While there are many great presentation media programs out there (Canva, Adobe Spark, and Google Slides, just to name a few), Microsoft PowerPoint remains a major player. In fact, April 20th will mark it’s 35th anniversary. But this middle-aged presentation media giant has probably aged better than your Sony Walkman or Nintendo Gameboy of the same era.
PowerPoint has continually adapted to fit the changing needs of the presentation field, like data visualization capabilities. Today, we’ll cover 5 rules for using PowerPoint for data visualization (data viz).
1. Use both Excel and PowerPoint.
Microsoft Excel is great for organizing raw research. But it’s not something you want to use for your presentation. PowerPoint can take your Excel data and turn it into graphics that are more attractive and easier to understand. Start by setting up your data in Excel. Then hop over to PowerPoint and create a new slide by clicking on the graphs option.
![]()
Select the type of graph you want to use (we’ll talk more about this below). Once you’ve done that, a chart menu will open up in PowerPoint that looks like Excel.
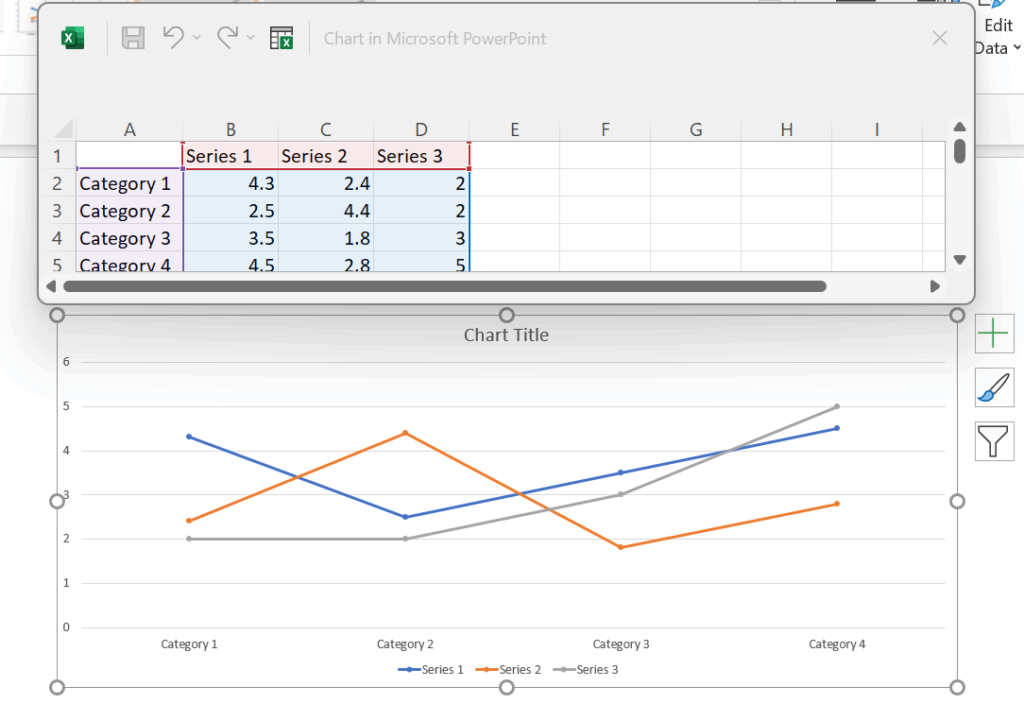 Simply copy and paste your data from Excel into the PowerPoint chart. Your data will automatically populate into the type of graphic you chose.
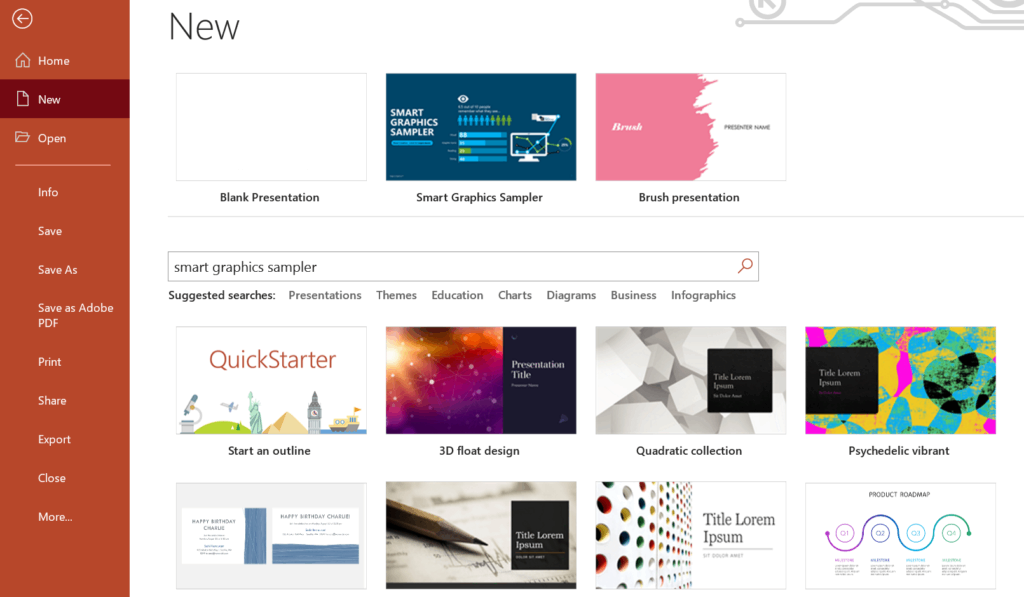
One of the quickest ways to see what you can do with data visualization in PowerPoint is to take a look at the “Smart Graphics Sampler” in the Templates menu. This educational template gives an overview of all you can do with smart graphics in PowerPoint.
2. Define your purpose & choose the right graphic.
Before creating great data viz in PowerPoint, you need to know the purpose behind it. Why are you creating it? For whom? What is the story you are trying to tell? At Ethos3, we believe that all great presentations and graphics start from great stories. So take some time to write down your story. It’s only then that you can create meaningful data visualizations.
Once you define your purpose, it’s time to choose the right graphic. Don’t let the large menu of available tools scare you. Check out this overview from wpDataTables of the different types of charts and how to use them. For example, you’ll probably want to choose a bar graph if you want to compare your company or product with a competitor. But a line graph would be a better choice for showing change over time.
3. Know when to customize.
As you are building your data visualizations, don’t be afraid to customize things. The great thing about PowerPoint is that it gives you control over how your graphic looks. Most of the smart graphics within PowerPoint have presets. Like standard axis titles and graph lines. Here’s an example of a company’s research over 12 years of how many customers are opening their emails. This was created using PowerPoint’s smart line graph option.
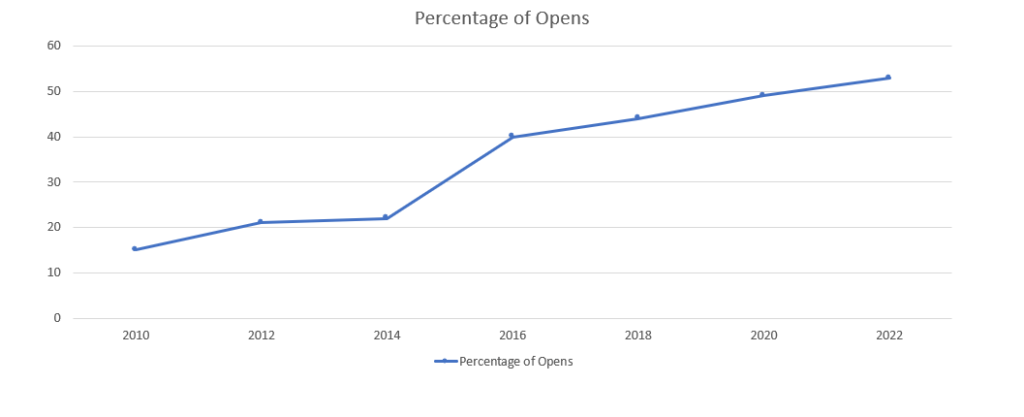 We’ve got a good starting point, but the data viz can be much better with some simple customizations.
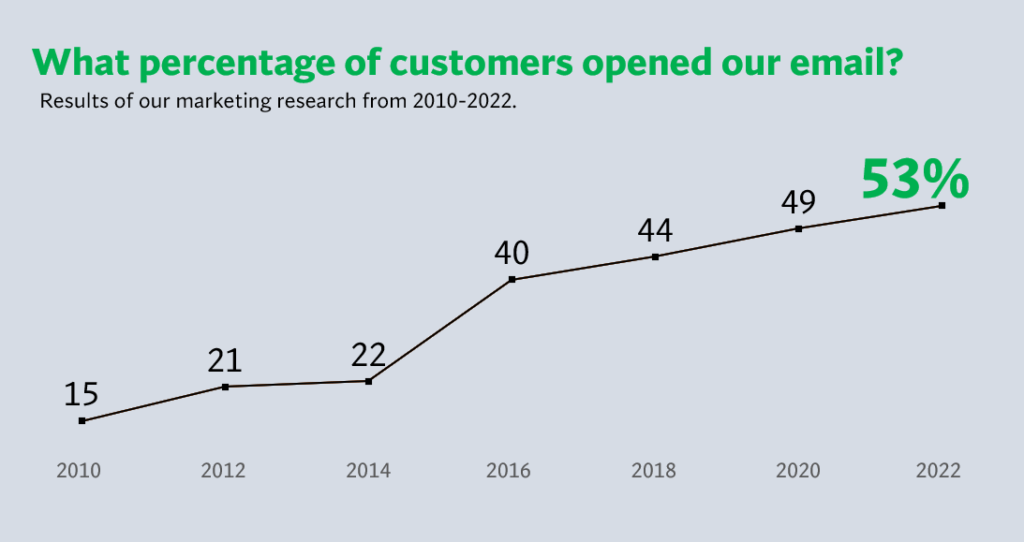 Here are the customizations I made in the data viz above:
-
I removed all graph lines to reduce visual clutter.
-
PowerPoint’s smart chart options let me add the years of data collection on the X axis, but I wanted more flexibility on text placement. So I chose to hide the axis and then just created my own text box so I had more control over where the text was placed.
-
I moved the percentages on the Y axis to appear right above the data markers and took out the Y axis all together.
-
I added custom colors that matched the company’s branding.
4. Know when not to customize.
Just because PowerPoint allows you to customize just about everything on your data visualizations, doesn’t mean you should. At least not always. Aim to have consistent colors, fonts, sizes, and shapes throughout your entire slide deck. A PowerPoint presentation should never look like your grandma’s quilt, with each new slide looking completely different from the last. Remember, it’s about telling a cohesive story.
5. Keep your audience in mind.
Great data viz is always about the story you are sharing and the audience you are sharing it with. The example above tells the story of a company who is now reaching more customers than ever. The 53% stands out because I’ve customized both the size and color, directing the audience’s gaze. In addition, I replaced a boring title (percentage of opened email) with a title that poses a question: What percentage of customers opened our email? The answer is clearly shown: 53%. It’s our job as presenters to help our audience understand any data we present more easily. Ideally, in one short glance.
We need research. It solves problems and identifies patterns. But we need it presented in ways that make sense. Fortunately, PowerPoint has been helping presenters do just that for years.
